
Between Tuesday 31 August 2010 and Thursday 2 September 2010, the Boston Red Sox played three away games against the Baltimore Orioles in Oriole Park.
Game One – Tuesday 31 August 2010
Red Sox 2 runs 8 hits 1 error
Orioles 5 runs 9 hits 0 errors
Red Sox lost
Game totals: 7 runs 17 hits 1 error
Analysis: Red Sox had 28.57% of the game runs, 47.06% of the game hits, 100% of the game errors
Game Two – Wednesday 1 September 2010
Red Sox 9 runs 11 hits 0 errors
Orioles 6 runs 10 hits 0 errors
Red Sox won
Game totals: 15 runs 21 hits 0 errors
Analysis: Red Sox had 60.00% of the game runs, 52.38% of the game hits, 0.00% of the game errors
Game Three – Thursday 2 September 2010
Red Sox 6 runs 9 hits 1 error
Orioles 4 runs 8 hits 1 error
Red Sox won
Game totals: 10 runs 17 hits 2 errors
Analysis: Red Sox had 60.00% of the game runs, 52.94% of the game hits, 50.00% of the game errors
Combined Totals
Red Sox 17 runs 28 hits 2 errors
Orioles 15 runs 27 hits 1 error
Red Sox: two wins, one loss
Totals: 32 runs 55 hits 3 errors
Analysis: Red Sox had 53.13% of the total runs, 50.91% of the total hits, 66.67% of the total errors
Hitting (Season)
Red Sox wins when hitting in double digits = 46
Red Sox losses when hitting in double digits = 16
Total number of games = 62
Red Sox won 74.19% of the games when hitting in double digits
Red Sox wins when hitting in single digits = 30
Red Sox losses when hitting in single digits = 42
Total number of games = 72
Red Sox won 41.67% of the games when hitting in single digits
Season-To-Thursday 2 September 2010
Red Sox: 675 runs 1252 hits 87 errors
Opponents: 610 runs 1147 hits 68 errors
Red Sox: seventy-six wins, fifty-eight losses
Totals: 1285 runs 2399 hits 155 errors
Analysis: Red Sox had 52.53% of the total runs, 52.19% of the total hits, 56.13% of the total errors
AL East Standings (at the start of Friday 3 September 2010)
New York 84 50 .627
Tampa Bay 82 51 .617
Boston 76 58 .567
Toronto 69 64 .519
Baltimore 49 85 .366
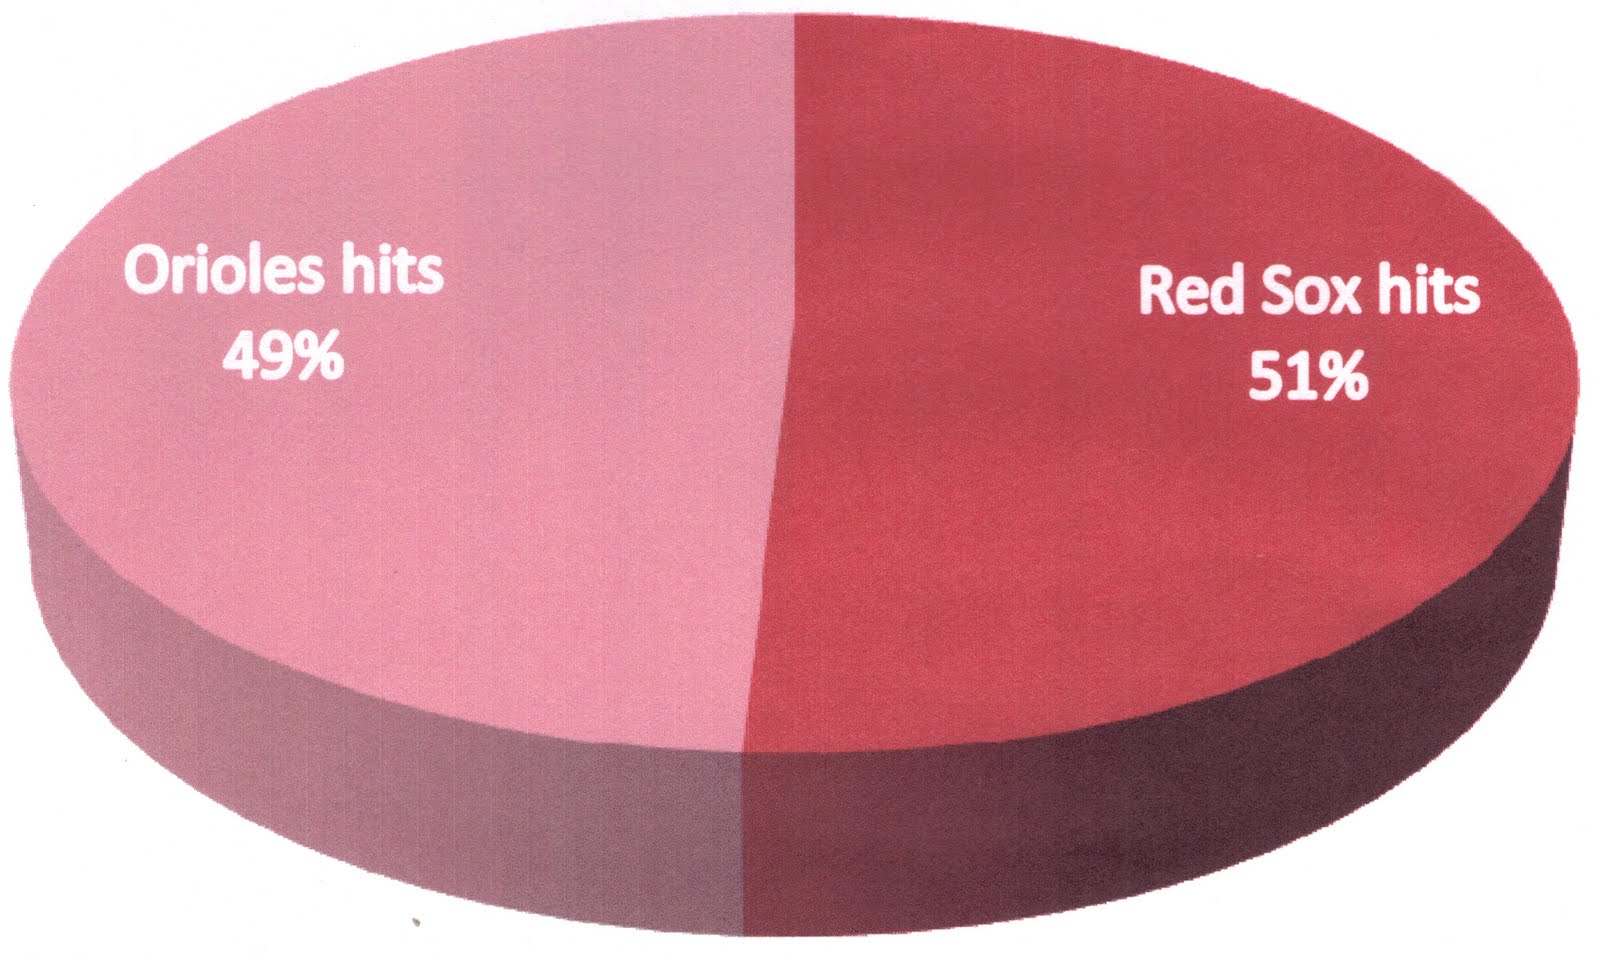
Images:
Left: Pie chart of percentage share of runs between the Red Sox and Orioles
Right: Pie chart of percentage share of hits between the Red Sox and Orioles
No comments:
Post a Comment
Note: Only a member of this blog may post a comment.